The Complete Guide to Index Fund Expense Ratios

Why Index Fund Expense Ratios Can Make or Break Your Retirement
Index fund expense ratios are the annual fees that funds charge to cover their operating costs — and for retirees and near-retirees, understanding them is one of the most important steps you can take to protect your savings.
Quick answer: What is an index fund expense ratio?
- It is expressed as a percentage of your investment (e.g., 0.04%)
- It is deducted automatically from the fund’s assets — you never see a separate bill
- It covers management, administration, legal, auditing, and marketing costs
- Lower is almost always better for long-term investors
Here is how today’s average expense ratios compare across fund types:
| Fund Type | Average Expense Ratio (2024-2025) |
|---|---|
| Index equity mutual funds | 0.05% |
| Index bond mutual funds | 0.05% |
| Index equity ETFs | 0.14% |
| Index bond ETFs | 0.10% |
| Actively managed mutual funds | 0.87% |
| Active ETFs | 0.74% |
These numbers may look small. But they are not.
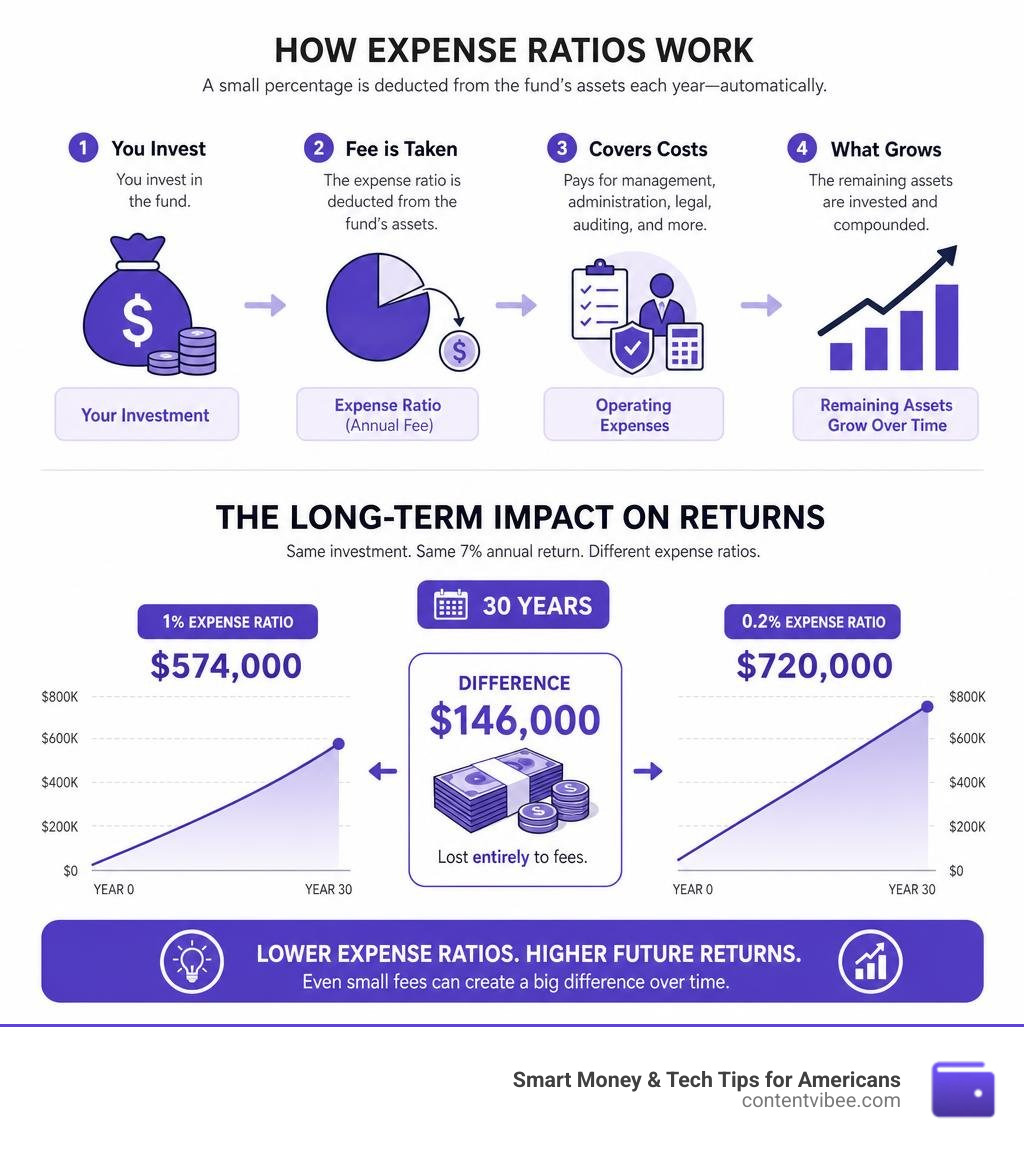
A $100,000 investment growing at 7% annually for 30 years with a 1% expense ratio ends up worth around $574,000. Drop that fee to 0.2%, and the same investment grows to roughly $720,000. That is a difference of nearly $146,000 — lost entirely to fees.
For someone approaching retirement or already in it, that gap is not abstract. It is real money you could have had.
This guide breaks down exactly how expense ratios work, how index funds compare to other options, and how to find the lowest-cost funds for your situation.
Understanding Index Fund Expense Ratios and How They Work

To master your investments, you do not need an advanced degree in mathematics. However, you do need to understand how index fund expense ratios are calculated and how they quietly chip away at your portfolio’s value.
At its core, an expense ratio represents the percentage of a fund’s total assets that go toward operating and managing the fund each year. The calculation formula is straightforward:
$$\text{Expense Ratio} = \frac{\text{Total Annual Operating Expenses}}{\text{Fund’s Average Net Assets}}$$
For example, if an index fund manages $100 million in total assets and incurs $50,000 in annual operating expenses, its expense ratio is 0.05%.
The most critical thing to understand is that you will never receive an invoice or a monthly bill for this fee. Instead, these expenses are deducted automatically from the fund’s assets on a daily, ongoing basis. This deduction is reflected directly in the fund’s daily Net Asset Value (NAV). If the underlying stocks in your S&P 500 index fund gain 10% in a year, but the fund has a 0.10% expense ratio, your actual return will be 9.90%.
Because these fees are quietly deducted behind the scenes, many investors overlook them entirely. The Securities and Exchange Commission (SEC) frequently warns investors about the compounding dangers of these quiet operational costs in its SEC Investor Bulletin: Mutual Fund Fees and Expenses. To help everyday investors demystify these calculations, we have put together a guide on How to Master Management Expense Ratio Mutual Funds Without a Math Degree.
The Core Components of an Expense Ratio
When you look at a fund’s prospectus, the expense ratio is presented as a single percentage. However, that single number is actually a bundle of several distinct operational costs. The three primary components include:
- Management Fees: This is the money paid to the fund’s investment advisor or management team. Even though index funds simply replicate an existing benchmark (like the S&P 500 or the CRSP US Total Market Index), they still require professionals to manage cash inflows, handle dividend reinvestments, and execute trades to keep the fund aligned with the index. You can read more about how these vary in our guide on the Average Management Fee for Mutual Funds.
- 12b-1 Fees: Named after Section 12b-1 of the Investment Company Act of 1940, these are operational charges used to pay for marketing, distribution, and broker commissions. Many investor-rights advocates consider 12b-1 fees to be disguised broker commissions. In fact, industry data reveals that only about 2% of collected 12b-1 fees are actually used for advertising; the rest is typically funneled directly to intermediaries as ongoing compensation.
- Administrative and Other Expenses: This category covers the day-to-day legal fees, auditing expenses, custodial services, transfer agency costs, and shareholder record-keeping.
Gross vs. Net Expense Ratios
While researching funds, you will often encounter two different numbers: the gross expense ratio and the net expense ratio.
- Gross Expense Ratio: This is the total percentage of assets required to run the fund before any fee waivers or expense reimbursements are applied.
- Net Expense Ratio: This is the actual percentage that you, the investor, pay out of pocket.
Fund managers, especially those launching new funds or trying to remain competitive in a crowded market, will often agree to temporary or contractual fee waivers. For example, a fund might have a gross expense ratio of 0.45%, but the manager agrees to waive 0.35% of those fees to keep the fund competitive. This results in a net expense ratio of 0.10%.
These fee waivers are legally binding for a set period (often detailed in the fund’s prospectus), but they can change or expire without much fanfare once the contract ends. For example, in the regulatory filings for the iShares S&P 500 Index Fund – INV A, INST and the T. Rowe Price Equity Index 500 Fund Summary Prospectus, you can see how different share classes utilize contractually agreed-upon waivers to lower net costs for specific investors—sometimes reducing net expenses to as low as 0.00% for institutional tiers. Always look at the net expense ratio to see what you are currently paying, but keep an eye on the gross ratio to know what the fund could cost if those waivers expire.
Comparing Index Funds, ETFs, and Actively Managed Funds

For decades, Wall Street relied on actively managed mutual funds. In these funds, highly paid portfolio managers and armies of analysts try to beat the market by hand-picking individual stocks. Unsurprisingly, this human intervention comes at a steep premium.
With passive management, the goal is not to beat the market, but to be the market. By tracking a established index, passive funds eliminate the need for costly research and frequent trading. This structural difference explains why index fund expense ratios are dramatically lower than active fees.
According to Morningstar data from 2025, the average ETF expense ratio was 0.48% for index ETFs and 0.74% for active ETFs. Meanwhile, the average mutual fund expense ratio was 0.58% for index mutual funds and 0.87% for actively managed mutual funds.
The long-term shift toward lower fees is clear. As documented in the Mutual Fund and ETF Fees Remained Near Historic Lows in 2025 report, investor demand has forced asset managers to continuously slash costs. To understand how these fees can quietly erode your hard-earned nest egg, check out our guide on How Mutual Fund Fees Can Ghost Your Retirement Savings.
Why Index Fund Expense Ratios Are Lower Than Active Fees
The massive price discrepancy between active and passive funds comes down to three main operational factors:
- Minimal Research Costs: Passive funds do not need to hire highly paid research analysts to visit corporate headquarters or analyze balance sheets. They simply buy the stocks listed on a target index.
- Low Portfolio Turnover: Actively managed funds constantly buy and sell stocks to chase short-term gains, which triggers heavy transaction fees and brokerage commissions. In contrast, index funds only trade when the underlying index changes its composition. For instance, the S&P 500-tracking Schwab Funds Prospectus – February 26, 2026 reveals a microscopic portfolio turnover rate of just 3%.
- No Star Manager Salaries: There are no multi-million dollar manager bonuses to fund when your portfolio is effectively run by an algorithm designed to match a benchmark.
Index Mutual Funds vs. Index ETFs
While both index mutual funds and Exchange-Traded Funds (ETFs) are passive investment vehicles, they differ in how they are traded and structured.
- Trading Mechanisms: Mutual funds are priced once per day at the market close (representing the end-of-day NAV). ETFs trade on secondary stock exchanges throughout the day, meaning their prices fluctuate constantly based on market supply and demand.
- The Creation-Redemption Process: ETFs use a unique “in-kind” creation and redemption mechanism managed by authorized participants. This institutional process allows ETFs to avoid selling underlying securities to meet investor redemptions, making them incredibly tax-efficient. Mutual funds, on the other hand, must often sell stocks to pay out departing investors, which can trigger taxable capital gains for the remaining shareholders.
- The Fee Convergence: Historically, ETFs had a reputation for being significantly cheaper than mutual funds. However, the fee wars of the last decade have mostly closed this gap. Prominent index mutual funds from providers like Schwab and Fidelity now charge as little as 0.015% to 0.02% for S&P 500 index tracking, which is actually lower than many comparable ETFs.
According to the 2026 US Fund Fee Study, the asset-weighted average expense ratio across all US funds fell to 0.32% in 2025, down from 0.80% in 2006. This ongoing fee compression saved American investors an estimated $6.8 billion in 2025 alone.
The Long-Term Impact of Fees on Investment Returns
Many investors look at a 1% fee and think, “What is the big deal? I get to keep 99% of my money!”
But this perspective ignores the wealth-destroying power of compounding fee drag. When you pay an expense ratio, you are not just losing the cash fee itself. You are losing the compound interest that money would have earned over the next ten, twenty, or thirty years.
Over an investing lifetime, this opportunity cost can easily consume a massive chunk of your final retirement balance. To see how your specific portfolio might be affected, you can run your own numbers using our Expense Ratio Impact Calculator.
The Cost of a 1% Fee Over 30 Years
To put this compounding fee drag into perspective, let’s look at a concrete example. Imagine you invest $100,000 in a portfolio that earns an average annual return of 7% before fees. Here is how different expense ratios impact your final balance over 30 years:
- 0.20% Expense Ratio (Low-Cost Index Fund): Your portfolio grows to approximately $720,000. You lose very little to management fees, allowing compounding to do the heavy lifting.
- 1.00% Expense Ratio (Typical Active Mutual Fund): Your portfolio grows to approximately $574,000.
- The Fee Penalty: You paid $146,000 in cumulative fees and lost compounding returns. That is nearly 20% of your potential retirement wealth gone.
This dramatic loss of wealth highlights several long-term fee realities:
- Fees compound negatively, acting as a permanent drag on your portfolio’s growth rate.
- High fees force you to work longer, save more, or lower your standard of living in retirement.
- Minimizing your investment costs is one of the few aspects of personal finance that is entirely within your control. You cannot control market returns, but you can control what you pay to Wall Street.
Total Cost of Ownership Beyond the Expense Ratio
While the expense ratio is the most visible fee, it is not the only cost associated with investing. To find the true total cost of ownership, you must look at several other factors:
- Brokerage Commissions: While most major brokerages now offer commission-free trading for online stock and ETF purchases, some platforms still charge transaction fees for certain mutual funds.
- Bid-Ask Spreads: Because ETFs trade on stock exchanges, they are subject to bid-ask spreads. This is the difference between the highest price a buyer is willing to pay and the lowest price a seller is willing to accept. For highly liquid, broad-market ETFs, this spread is microscopic (often just a penny), but it can be wider for niche or international funds.
- Tracking Error: This is the difference between the performance of the index fund and the actual index it is trying to copy. Tracking error occurs due to fund expenses, cash holdings, and trading delays.
- Tax Drag: As mentioned earlier, mutual funds can distribute capital gains to shareholders even if you did not sell any shares. This can create an unexpected tax bill in taxable accounts. To avoid these surprises, read our guide on how to Don’t Get Caught Off Guard by Stock Selling Fees.
How to Evaluate and Choose the Best Low-Cost Funds
With thousands of investment options available, selecting the right fund can feel overwhelming. However, by focusing on low-cost index funds, you can dramatically simplify the process.
Your first step should always be to review the fund’s official prospectus or summary prospectus. This document contains a standardized “Fees and Expenses” table that outlines the exact shareholder fees and annual operating expenses you will pay. For a real-world look at how clean and transparent these fee tables can be, you can examine the SP 585 Vanguard Total Stock Market Index Fund prospectus, which discloses a tiny 0.04% expense ratio for its Admiral Shares.
To maximize your returns, it is also wise to hold these low-cost funds in tax-advantaged accounts. Learn how to keep more of your money by exploring our guide on the Stop Paying Platform Fees: Top Tax-Free Investment Accounts.
How to Compare Index Fund Expense Ratios Across Platforms
To find the most competitive rates, make use of the free tools provided by your brokerage platform:
- Use Fund Screeners: Most major online brokerages have robust screening tools that let you filter ETFs and mutual funds by asset class, index tracked, and expense ratio.
- Check the Share Class: Many mutual funds offer multiple “share classes” for the exact same pool of underlying stocks. Retail share classes often carry higher fees and minimum investment requirements, while institutional share classes offer the lowest fees but require massive starting balances. Always verify which share class you are purchasing.
- Watch Out for Platform Wrap Fees: Even if you buy a zero-expense index fund, your brokerage or robo-advisor might charge an overall “platform” or “wrap” fee to manage your account. You can learn more about these layered costs in The Ultimate Guide to Robo Advisor Fees.
When is a Higher Expense Ratio Justified?
While our general rule of thumb is to keep costs as close to zero as possible, there are a few scenarios where paying a slightly higher expense ratio might be justified:
- Niche and Emerging Markets: Tracking stocks in developing countries (like India, Brazil, or Vietnam) requires navigating complex local regulations, foreign exchange conversions, and higher trading costs. An index fund tracking these markets will naturally carry a higher expense ratio (often 0.30% to 0.50%) than a basic US large-cap fund.
- Specialized Strategies: If you want exposure to specific factors, specialized fixed-income products, or commodities (like physical gold), the operational complexity of holding these assets justifies a slightly higher fee.
- Excellent Tracking Efficiency: A fund with a 0.03% expense ratio that suffers from poor execution and high tracking error might actually underperform a well-run fund with a 0.06% expense ratio. Always look at the fund’s historical performance relative to its index to ensure it is doing its job efficiently.
Frequently Asked Questions About Index Fund Fees
Do index funds have hidden transaction fees?
Yes, but they are not listed in the expense ratio. Index funds incur internal transaction costs (brokerage commissions, bid-ask spreads, and market impact costs) when they buy and sell securities within the portfolio. These trading costs are deducted directly from the fund’s assets and are reflected in its overall performance, rather than being broken out as a separate fee. A low portfolio turnover rate (under 10%) is the best indicator that these internal transaction costs are being kept to a absolute minimum.
How do I find the expense ratio of an index fund?
You can easily find a fund’s expense ratio by typing its ticker symbol into any major financial portal (like Yahoo Finance, Morningstar, or Google Finance). It will also be prominently displayed on your brokerage’s trading platform, on the fund sponsor’s official product page, and in the “Fees and Expenses” table at the very beginning of the fund’s prospectus.
Are ETF expense ratios always lower than mutual fund expense ratios?
Not always. While the median expense ratio for ETFs is historically lower than that of mutual funds, the fee gap has narrowed significantly. Today, major brokerage firms offer institutional-grade index mutual funds to retail investors with expense ratios that match or even beat comparable ETFs. However, ETFs still maintain a structural cost advantage over retail-class mutual funds that carry front-end loads or 12b-1 marketing fees.
Conclusion
At Suppremo, we believe that building a secure retirement does not have to be overly complicated. While you cannot control which way the stock market moves tomorrow, you have complete control over the fees you pay to Wall Street.
By prioritizing low-cost index fund expense ratios, you ensure that more of your hard-earned money remains in your portfolio, compounding quietly for your future. Whether you are managing your own investments or using automated platforms, keeping an eye on these operational costs is one of the single most effective ways to maximize your long-term retirement security.
Ready to take the next step in optimizing your portfolio? Head over to our comprehensive Expense Ratio Impact Guide to learn more actionable strategies for keeping your investing costs at an absolute minimum.